Research note
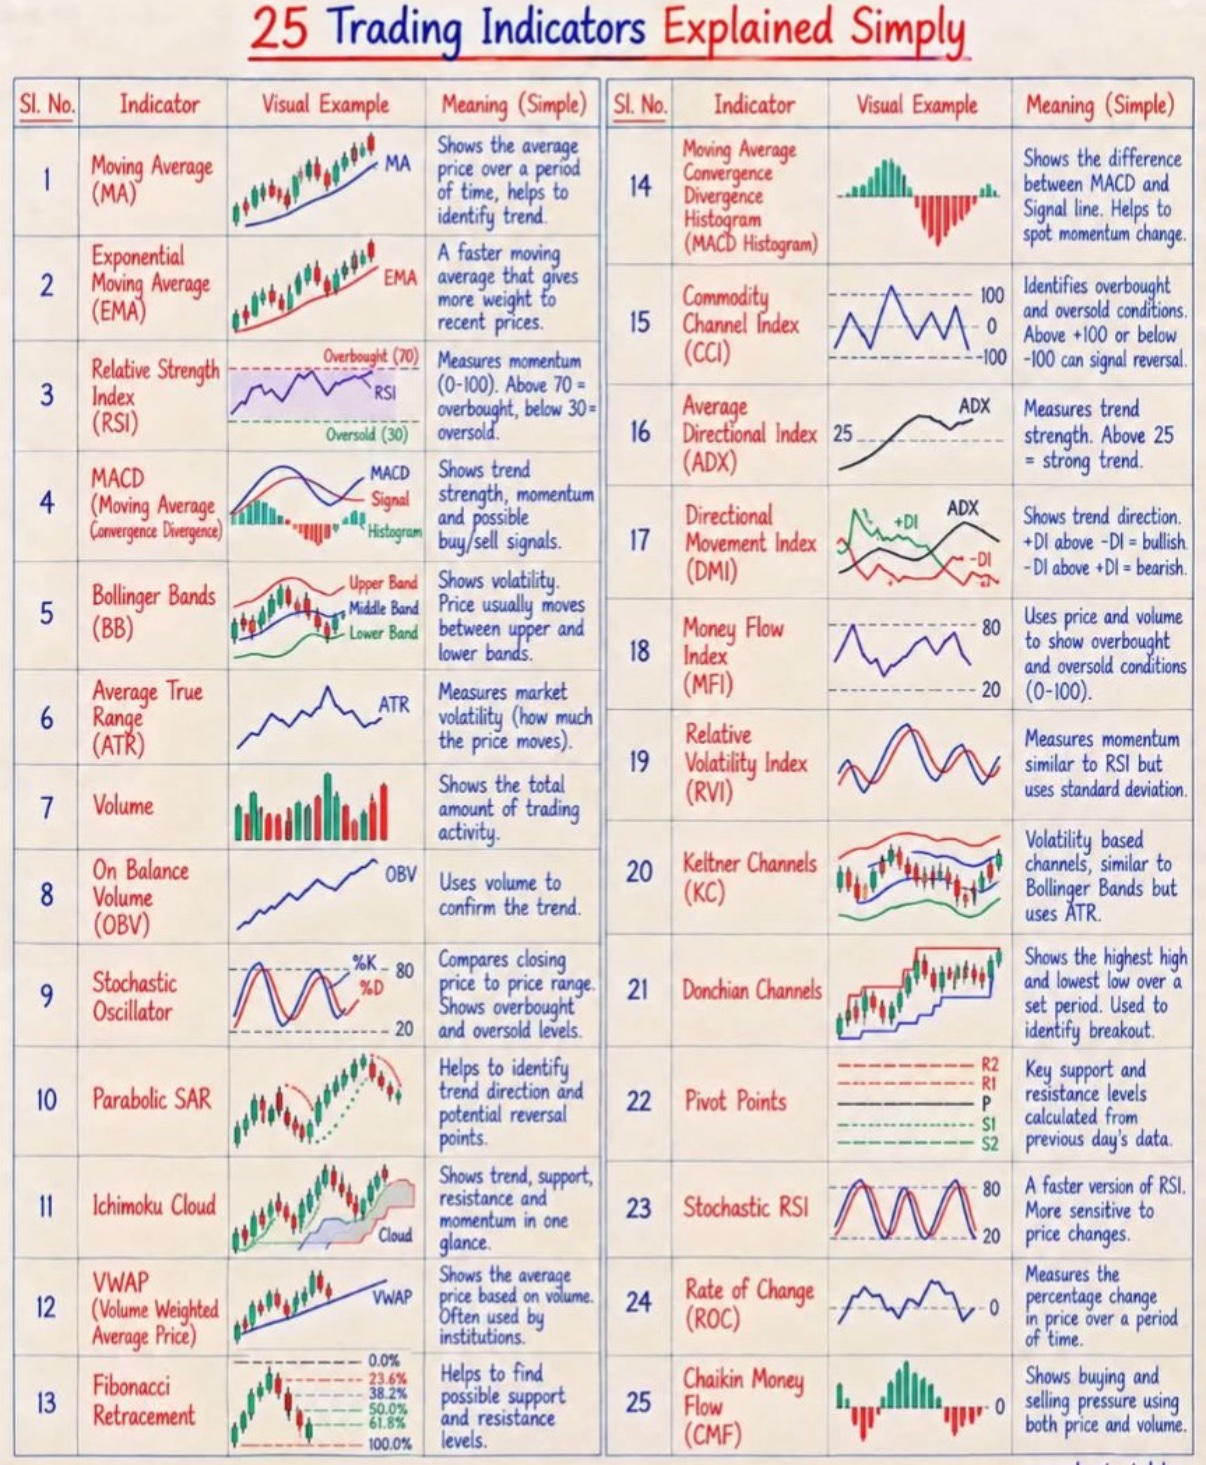
25 trading indicators, explained simply
Moving averages, RSI, MACD, Bollinger Bands and 21 more indicators in plain language: what each one measures, how traders usually read it, and where each one misleads.
Short answer: the indicators below are just price or volume run through a formula. They cannot see the future; they can only reorganise the past into a shape that is easier to read. The 25 below fall into four families: trend, momentum, volatility, and volume. Knowing which family an indicator belongs to matters more than memorising its thresholds, because two indicators from the same family usually tell you the same thing twice.
This post explains each one in plain language: what it measures, the conventional reading, and where it tends to mislead. It describes methods. No indicator here is presented as an edge.
Trend indicators: which way is price moving?
1. Moving Average (MA)
The average closing price over a chosen window, recalculated each bar. A 50-day MA is the mean of the last 50 closes; a 200-day MA is the mean of the last 200. Price above a rising MA is read as an uptrend, price below a falling MA as a downtrend. Crosses of price through the MA, and of a short MA through a long one, are the classic trend-change signals.
Where it misleads: every average lags. In a sideways market price crosses a moving average constantly, producing whipsaw signals that lose a little each time.
2. Exponential Moving Average (EMA)
The same idea, but recent prices count more than old ones, with the weight decaying exponentially. A 20-day EMA reacts to a new move faster than a 20-day simple MA, which is why short-term traders tend to prefer it.
Where it misleads: faster reaction also means more false turns. Speed is not accuracy; it is a trade-off between lag and noise.
3. MACD (Moving Average Convergence Divergence)
MACD takes a fast EMA minus a slow EMA (conventionally 12 minus 26). That difference is the MACD line; a 9-period EMA of it is the signal line. When the MACD line crosses above the signal line, momentum is read as turning up; below, turning down. The gap between the two lines is the histogram.
Where it misleads: in a strong trend, MACD can stay on one side for weeks, and in a range it crosses back and forth like any average-based tool.
4. Parabolic SAR
A series of dots that trail price, below it in an uptrend and above it in a downtrend. The dots accelerate toward price each time the trend makes a new extreme, so a touch of price to a dot is read as the trend ending and flipping.
Where it misleads: it is designed to always be in a position, long or short, so in a choppy market it flips repeatedly and bleeds.
5. Ichimoku Cloud
Five lines from one system: a fast conversion line and a slow base line, a lagging line plotting today's close shifted back, and a cloud formed by two forward-shifted averages. Price above the cloud is read as an uptrend, below it as a downtrend, inside it as indecision. The cloud's thickness is read as support or resistance.
Where it misleads: with five lines and a forward-shifted cloud, it is easy to find a story for any chart after the fact. The cloud's forward projection is arithmetic, not a forecast.
6. Pivot Points
Levels computed from the previous day's (or week's, or month's) high, low, and close: a central pivot plus support and resistance levels above and below it (commonly labelled R1, R2, S1, S2). Traders watch whether price respects or breaks these levels.
Where they mislead: the standard levels are the same for everyone using the same formula and session, which is both their strength and their weakness — a level only matters if enough participants act on it, and on a strongly trending day price can walk straight through the levels in its path.
Momentum indicators: how fast is price moving?
7. Relative Strength Index (RSI)
RSI compresses recent gains and losses into a 0–100 scale, conventionally over 14 periods. Above 70 is labelled overbought, below 30 oversold. The idea is that an extreme reading warns that a move is stretched.
Where it misleads: in a strong trend RSI can sit above 70 or below 30 for a long time while price keeps going. "Overbought" means stretched, not "about to fall" — fading a strong trend on RSI alone is one of the classic ways to lose steadily.
8. Stochastic Oscillator
The stochastic compares the latest close with the recent trading range: where today's close sits between the period's low and high, as a percentage. Its two lines (%K and %D) run 0–100, with 80 and 20 as the usual overbought and oversold marks.
Where it misleads: same family problem as RSI, only faster. It is jumpier, so it gives more signals and more false ones in trends.
9. Stochastic RSI
RSI fed through the stochastic formula: instead of price's position in its range, it measures RSI's position in its own recent range. The result moves faster than plain RSI and hits its 80/20 extremes (on the usual 0–100 display) more often.
Where it misleads: it inherits both parents' weaknesses and adds sensitivity. More signals is not more information.
10. Commodity Channel Index (CCI)
CCI measures how far price sits from its own typical average, scaled so that most readings fall between −100 and +100. Readings beyond those bounds are read as unusually stretched, and a return inside the bounds is sometimes read as a reversal signal.
Where it misleads: as with other oscillators, it can spend long stretches beyond its ±100 reference levels during real trends. The bounds are statistical conventions, not physical laws.
11. Rate of Change (ROC)
The simplest momentum gauge: today's price minus the price N periods ago, as a percentage. Rising ROC means measured momentum is strengthening; falling ROC means it is weakening, even if price is still rising.
Where it misleads: ROC is noisy by construction — it compares two single closes and ignores everything between them.
12. Relative Volatility Index (RVI)
RVI applies the RSI formula not to price changes but to the standard deviation of closes: it rises when recent volatility is dominated by up days and falls when down days dominate. It is RSI's cousin, with volatility as the input instead of the size of price changes.
Where it misleads: it answers a narrower question than traders usually ask it. High RVI does not mean price is going up; it means recent volatility has been upward-flavoured.
13. Money Flow Index (MFI)
MFI is RSI with volume attached: it weights up and down moves by how much traded. The 0–100 scale mirrors RSI, and its usual extremes are 80/20, but a move on heavy volume counts more than the same move on light volume.
Where it misleads: volume data is messier than price data (off-exchange prints, dark-pool volume, venue differences), and the index inherits all of RSI's trend problems on top.
14. MACD Histogram
The histogram is just the MACD line minus its signal line, plotted as bars. Growing bars mean the gap between the two lines is widening (momentum strengthening); shrinking bars mean it is narrowing (momentum fading). Traders watch the histogram turn before the lines themselves cross.
Where it misleads: it is a derivative of a derivative — two layers of smoothing away from price — so its early warnings are also its early false alarms.
Volatility indicators: how much is price moving, and how strong is the trend?
15. Average True Range (ATR)
ATR averages the true range (the largest of today's high–low, high minus prior close, and prior close minus today's low) over, conventionally, 14 periods. It measures how much a market typically moves, not which direction. A rising ATR means bigger swings; a falling ATR means a quieter market.
Where it misleads: ATR is often mistaken for a directional signal. It is not. It is most useful for position sizing and stop placement: a stop tighter than one ATR is likely to be hit by ordinary noise.
16. Bollinger Bands
A middle band (usually a 20-period simple MA) with upper and lower bands set a number of standard deviations away (usually two). When volatility rises, the bands widen; when it falls, they narrow. Price touching the upper band is sometimes read as overbought, the lower as oversold.
Where it misleads: bands are drawn from the same price they are supposed to judge, so in a strong trend price can "walk the band" for weeks. A squeeze (narrow bands) signals low volatility, not the direction of the breakout that follows.
17. Keltner Channels
Keltner Channels look like Bollinger Bands but build the outer bands from ATR instead of standard deviation: in the modern version, a central EMA plus or minus a multiple of ATR. The result is a smoother channel that widens with volatility.
Where it misleads: the same walk-the-band problem as Bollinger Bands, and the two channel systems often disagree about where the edge is — a reminder that the "edge" is a construction, not a property of the market.
18. Donchian Channels
The upper line is the highest high of the last N periods, the lower line the lowest low, and the middle line their average. A close above the previous N bars' upper line is a breakout to a new N-period high; below the previous N bars' lower line, a breakdown.
Where it misleads: the channel is only as meaningful as the window. A 20-day channel in a trending market breaks constantly; a 55-day channel retains older extremes longer, but can still update every day. The choice of N does most of the work, and it is rarely justified.
19. Average Directional Index (ADX)
ADX measures trend strength on a 0–100 scale, without direction: above 25 is conventionally read as a strong trend, below 20 as no trend. It is built from the directional movement lines (+DI and −DI) but strips out which way they point.
Where it misleads: ADX itself lags badly, because it smooths already-smoothed directional data. By the time it confirms a strong trend, much of the move may be over, and it says nothing about when the trend ends.
20. Directional Movement Index (DMI)
DMI is the pair behind ADX: +DI measures upward movement strength, −DI downward movement strength. +DI above −DI is read as bullish, the reverse as bearish, and crosses of the two lines are read as trend-change signals.
Where it misleads: the two lines cross often in ranges, and like ADX they are smoothed, so the cross frequently arrives after the move it claims to signal.
Volume indicators: is the move backed by trading activity?
21. Volume
Raw traded volume per bar — the simplest indicator on this list and arguably the most honest. A price move on rising volume is read as better supported than the same move on thin volume, and volume spikes often mark capitulation or climax days.
Where it misleads: volume has no direction of its own, and "high" is relative — it needs a baseline (say, a 20-day average) before it means anything.
22. On Balance Volume (OBV)
OBV keeps a running total: add the day's volume when price closes up, subtract it when price closes down. The idea is that volume leads price — if OBV is rising while price is flat, accumulation is supposedly underway.
Where it misleads: it treats a close up a cent the same as a close up 5%, and it never resets, so its absolute level is arbitrary — only its movement carries information. Divergences between OBV and price are common and often resolve in price's favour.
23. Chaikin Money Flow (CMF)
CMF combines price position within the day's range with volume, summed over (conventionally) 20 or 21 periods and normalised to −1…+1. Positive values are read as buying pressure, negative as selling pressure.
Where it misleads: it is sensitive to the window, and it ignores the prior close — a bar that gaps down but closes near its own high still counts as buying pressure, while a locked-limit bar leaves the multiplier undefined. Like OBV, its divergences are frequent and unreliable on their own.
24. Volume Weighted Average Price (VWAP)
VWAP is the day's total traded value divided by total shares traded — the average price actually paid, weighted by volume. Institutions use it as an execution benchmark (did we buy below VWAP?); intraday traders use the line itself as a reference, buying below it and selling above it.
Where it misleads: VWAP resets daily, so it says nothing about yesterday. And as a benchmark it is gameable: trading heavily near the close drags VWAP toward your own fills.
25. Fibonacci Retracement
Unlike the volume tools above, Fibonacci retracement uses price alone: horizontal levels drawn at fixed fractions (23.6%, 38.2%, 50%, 61.8%) of a prior move, from its low to its high (or high to low). Traders watch whether a pullback stalls at one of these levels and resumes the original direction.
Where it misleads: the levels depend entirely on which swing the drawer chose, and different traders choose different swings — so the market is full of overlapping Fibonacci grids, and price will "respect" one of them by chance fairly often.
How to use this list without fooling yourself
Three habits separate a useful indicator from a horoscope:
1. One per family. A chart with RSI, stochastic, and stochastic RSI is not three confirmations; it is one momentum opinion counted three times. Pair a trend tool with a momentum tool and a volume tool instead. 2. Thresholds are conventions, not laws. 70/30 on RSI, 25 on ADX, two standard deviations on Bollinger Bands — these are round numbers people agreed on, not levels the market defends. Test any threshold on history before trusting it, and test it on data the rule was not fitted to. 3. An indicator describes; it does not predict. Every formula above is computed from past prices and past volume. If a setup cannot survive a backtest with costs, on out-of-sample data, it is a story, not an edge — no matter how clean it looks on the chart you picked.
The Terminal's Strategy Lab exists for exactly that check: a rule written from any of these indicators can be run against history before it touches real money. An indicator earns its place on your screen by surviving that test, not by appearing on a list.