Cycles & Fractals
Always-on research page: six data-backed research panels, two static tested-claim panels, two published reference charts, a growth stock cycle reference picture, a four-year cycle reference picture, plus eight fractal / cycle-theory diagram families rebuilt as MRT UI. Use them as mental models next to Psychology, Fear & Greed, and Education — not as forecasts or composite weights.
Loading seasonals research…
S&P 500 Monthly Seasonality
Share of months the S&P 500 was positive, plus the average monthly gain, from Terminal S&P 500 history.
Loading S&P 500 monthly seasonality…
CRB 30-Year Cycle — Tested Claim
Claim tested: @arvyMacroCycles, X, 2026-10-28 — equities, bonds and commodities move in 30–40 year cycles; CRB highs 1920 / 1950 / 1980 / 2008; the cycle points up into 2030–2040. Backtest frozen 2026-10-29; research only.
Tested claim — spacing not reproduced; equity linkage holds, bond linkage does not. Display-only research; not a trade input, never feeds Today's Trades or alerts.
Leg A — Cycle spacing
MIXED, leaning against — one gap matches; the others do not resemble a cycle
Method: Monthly series; a peak is a month equal to the maximum over a centered ±60-month window, deduplicated to ≥60 months apart.
| Peak | Value (index, 1982=100) |
|---|---|
| 1920-05 | 28.8 |
| 1951-02 | 30.9 |
| 2008-07 | 205.5 |
| 2014-04 | 208.3 |
Gaps: 30.75y / 57.41y / 5.75y. Median gap: 30.75y.
No 1980 peak on this proxy — PPIACO rose through the 1970s into 1984, and the 1990 spike exceeded the whole 1975–2003 stretch.
On the actual GSCI (1984 onward, same rule): peaks 1990-09 (270.2) and 2008-06 (862.8) only — one gap of 17.75y, no post-2008 peak.
The author's own marked gaps already break the 30–40 year label: 1980→2008 is 28y, and 2008→2030–40 would be 22–32y.
Leg B — The linkage
MIXED — the equity half holds; the bond half does not clear the bar
Commodity-bull regime = S&P GSCI above its trailing 252-session moving average AND its trailing 252-session return positive. Daily, 1984-01-03 → 2026-10-28. Regime share ≈ 46% of days.
| Cell | n (regime / total) | Regime mean | Unconditional mean | Excess (pp) | NW t | Significant? |
|---|---|---|---|---|---|---|
| SPX, 63 sessions | 4,952 / 10,727 | +1.47% | +2.59% | −2.08 | −2.59 | Yes |
| SPX, 252 sessions | 4,783 / 10,538 | +6.59% | +10.76% | −7.63 | −2.26 | Yes |
| Bond proxy, 63 sessions | 4,952 / 10,727 | +1.41% | +1.57% | −0.29 | −0.60 | No |
| Bond proxy, 252 sessions | 4,783 / 10,538 | +5.67% | +6.43% | −1.38 | −0.69 | No |
After commodity-bull days, the S&P 500 returned about 2.1pp less over the next quarter and 7.6pp less over the next year than usual, both statistically significant under overlap-robust inference.
Bond returns were lower after commodity-bull days (−0.29pp per quarter, −1.38pp per year), but the gaps are small and statistically indistinguishable from noise.
Secondary mechanism check (descriptive, not verdict-bearing): bull-regime months averaged 3.34% CPI YoY vs 2.86% unconditional (242 bull months of 512 total).
The 2030–2040 peak
NOT TESTABLE — a forward claim. No probability, no peak year, and no line is drawn for it. The regularity the projection assumes (a ~30-year spacing) was not reproduced in either free series tested.
Limits — read before citing
- Leg A tests a producer-price proxy (FRED PPIACO), not the CRB itself — the CRB's full history is not freely available. If the cycle is CRB-specific, this test cannot confirm or refute the CRB series itself.
- Leg B misses the 1970s bull — GSCI daily history starts 1984.
- Bonds = duration-8 total-return proxy from DGS10 yields, not a traded bond series.
- Equities = S&P 500 price return, dividends excluded.
- The regime fires on ~46% of days — ordinary uptrends, not only rare secular episodes.
Long-horizon research
Dow secular cycles
Observed monthly prices, computed regimes and an in-sample log trend. Distinct indexes retain their own evidence basis.
Loading Dow secular-cycle observations.
View from @arvymacrocycles
Cyclical bull and bear markets last 1 to 5 years. Secular trends last 15 to 20. The Dow's secular breakouts: 1915, 1945, 1982, 2013. In our view, the 2013 bull is maturing into a secular top. For the 2030s, we expect a boom-and-bust sideways market, like the 1970s.
Their view, not an MRT signal. Author's scenario, not a forecast.
SOX Cycle Check — Claimed, Unverified
A social post claimed the PHLX Semiconductor Index (SOX) moves in a roughly 2.5-year trough-to-trough cycle, with 8- and 10-month holds at the 40-week average and a return to a long-term trend line around October 2027.
UNVERIFIED — spacing reproduces only for the last two major troughs; the 8- and 10-month holds do not reproduce; the trend-line figure depends on the steepest-ever line. Display-only research; not a signal, not a forecast, never feeds Today's Trades or alerts.
Chart uses Friday weekly closes on a log scale; troughs are marked; data frozen 2026-11-03 through the week ending 2026-10-30.
| Week ending | Close | Gap from previous trough (weeks) |
|---|---|---|
| 2000-01-07 | 690.75 | — |
| 2001-09-28 | 373.7 | 90 |
| 2002-10-04 | 226.95 | 53 |
| 2004-09-03 | 357.84 | 100 |
| 2006-07-21 | 384.88 | 98 |
| 2008-11-21 | 180.22 | 122 |
| 2010-09-10 | 316.57 | 94 |
| 2011-08-19 | 326.32 | 49 |
| 2016-02-12 | 571.9 | 234 |
| 2018-12-21 | 1,101.29 | 149 |
| 2020-03-20 | 1,298.54 | 65 |
| 2022-10-14 | 2,162.32 | 134 |
| 2025-04-04 | 3,597.66 | 129 |
Gaps range 49 to 234 weeks across history; only the last two gaps (134 and 129 weeks) sit near 2.5 years; the October 2027 date is an extrapolation of one interval, not an established rhythm.
Under the check's definitions (touch = first weekly close at or below the 40-week average after a run above; clear break = two consecutive weekly closes below), the last two completed holds before the current episode were 1 week (May 2025) and 1 week (February 2025); no 8- or 10-month hold appears.
The line through the last two troughs sits at 4,510.05 at the last week, implying a 57.8% drop from the last close; 52 weeks later it sits at 5,088.63, implying a 52.4% drop; the previous trough pair's line implies a 63.9% drop over the same horizon, worse than 62%, so the roughly 50% figure is an artifact of picking the steepest line in history.
Last complete week ending 2026-10-30 closed at 10,688.80, below its 40-week average of 10,865.01 by 1.62%; the previous week (ending 2026-10-23) also closed below its average, so the check's two-consecutive-close definition of a clear break is met as of 2026-10-30. Note that the November 2 check counted only one close below on Yahoo's weekly bars; the refreshed Friday-close series changes that count, and the difference is the weekly-bar dating convention.
Weekly closes are Friday closes resampled from Yahoo daily closes for ^SOX, because Yahoo's weekly bars shift alignment with the requested window and cannot be reproduced; the November 2 check's "October 29" label for the 10,688.80 value was off by one day — that value is the Friday October 30 close. Trough = lowest Friday close within 26 weeks either side. Small sample: 13 major troughs. Nothing here is a forecast or a trade input.
Reference Charts
Market structure stages and the emotional cycle of long and short positions. Select a chart to open it full size.
© Brian Shannon / @alphatrends. Shown as published with watermarks intact; no crop or annotation.
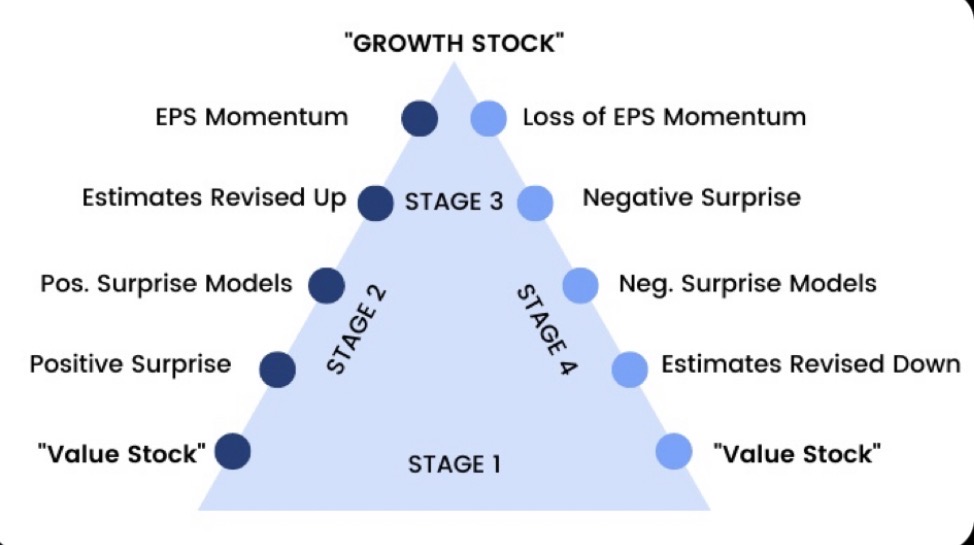
Growth Stock Cycle
Stage 1 is the value stock base. Stage 2 climbs as positive surprises and upward estimate revisions build EPS momentum. Stage 3 is the growth stock peak. Stage 4 slides as EPS momentum fades and estimates are revised down, back to a value stock. Educational reference only.
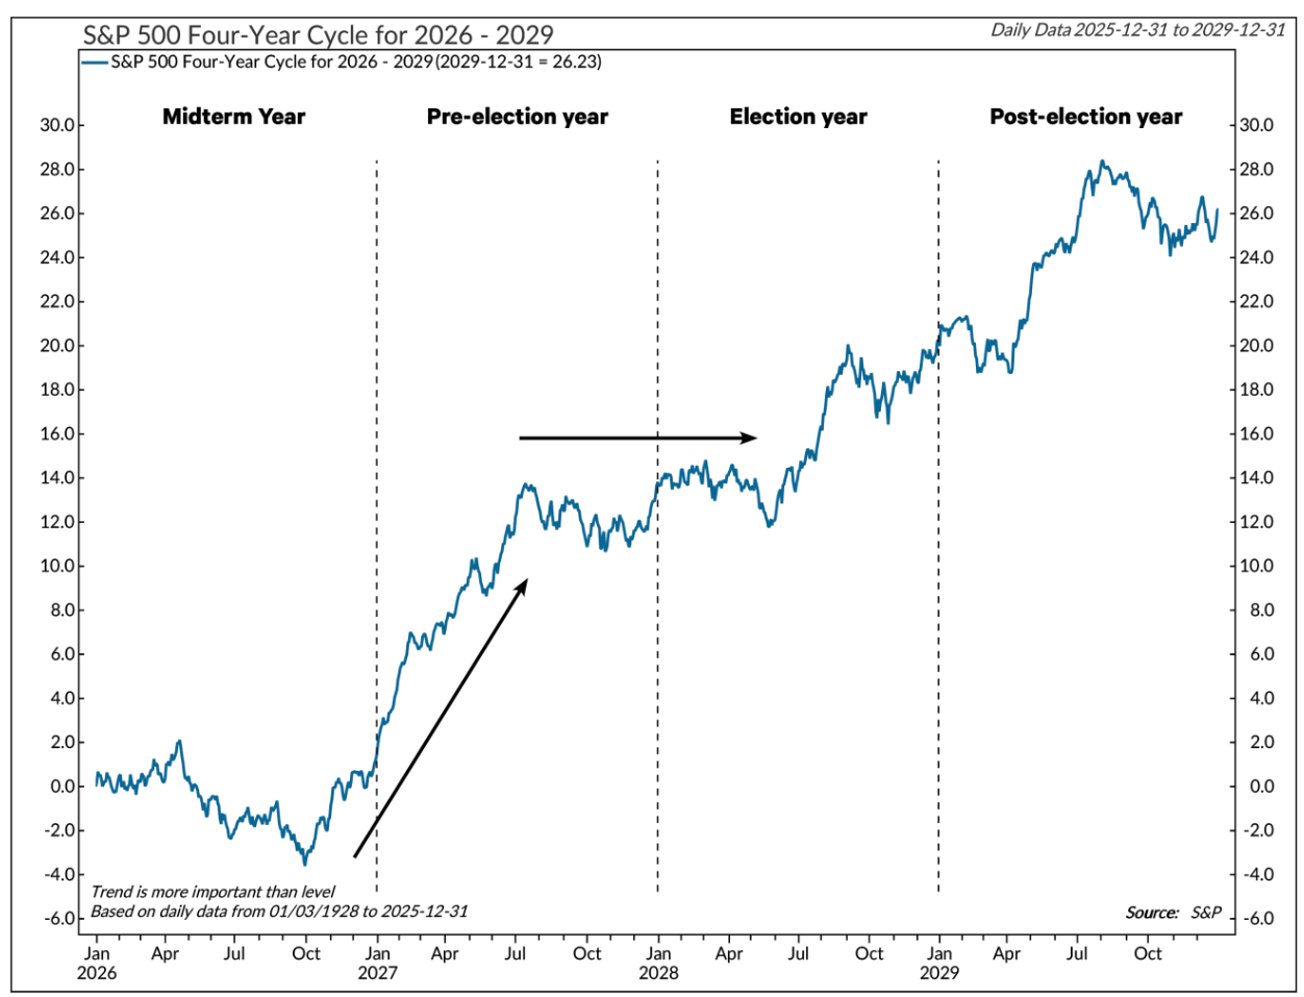
S&P 500 Four-Year Cycle (2026–2029)
The midterm year typically dips into October, the first half of the pre-election year is strong, then the path flattens. Composite of daily S&P 500 data since 1928. Trend matters more than level. Educational reference only.
Pullback Sequence (10/21 EMA)
A repeating price-action sequence: a hard run, a tight base, a pullback to the 10/21 EMA, an undercut, a tight pivot, then expansion. Same human behavior underneath, different stock, different theme.
The sequence is UNTESTED — no backtest, no edge claim. Display-only: not a signal, not a vote, not a forecast. The post gives no thresholds, so the stage definitions below are MRT's own.
- 1 · Big move up — ≥30% over 60 sessions.
- 2 · Tight consolidation — 10-day range ≤4% with tightening contractions.
- 3 · Pullback to the 10/21 EMA — First bar from the consolidation start, up to 10 bars past its end, whose low touches EMA21.
- 4 · Undercut — The day's low trades below EMA21 and the close reclaims back above EMA21 within 3 bars (a failed dip under the line).
- 5 · Tight pivot — First qualifying 5-bar window starting within 5 bars after the reclaim, with closes within ±1.5% of EMA21 and daily ranges narrowing.
- 6 · Expansion — Close above the consolidation range high, trigger-day range ≤ 1.0× ADR20.
Example charts — Terminal data, 365 days
Loading the EQIX chart…
Loading the TECH chart…
Live scanner — names at the pullback stage (S&P 500)
Sequence as described by @pheonix_trader in his Nov 4 2026 post. Example charts are rebuilt from Terminal data — the post's charts are not reproduced.
Parabolic Curve: Step-Like Formation
Four rising bases, each followed by a steeper markup, then a vertical blow-off. The smooth curve is the underlying parabola; the tip is the conceptual sell point.
MRT rebuild — parabolic step-like formation (education). Conceptual path, not a forecast or a signal.
Idealized Cycle Phases
Trough → rise → peak → decline with Accumulation / Markup / Distribution / Decline phase labels.
MRT rebuild — idealized market cycle phases (education).
Elliott Impulse + Corrective
Classic 5-wave impulse (1–5) followed by an ABC corrective structure — schematic education only.
MRT rebuild — Elliott Wave impulse/corrective structure (concept education; not a signal).
Elliott Fractal Breakdown
Every wave has the same pattern inside it at a smaller size — fractal nesting, not a forecast.
Full cycle
A larger wave is itself made of smaller waves, and the whole pattern repeats at the next size up. The five-wave rise is one wave of a larger degree, and the three-wave fall is the next one down.
Zoom in: the impulse
Wave 1 opens into five smaller waves, i through v.
Wave 2 opens into three smaller waves, a through c.
Then the 5-3-5 sequence again: wave 1 in five, wave 2 in three, wave 3 in five.
An impulse breaks into five, then three, then five, then three, then five smaller waves.
Zoom in: the correction
Coming down, A splits into 5, B into 3, and C into 5 smaller waves.
Pull back: two bigger waves
Zooming out, the whole cycle collapses into two bigger waves: one up, one down.
The consistency rule
A count can be tested from both sides. A daily count has to make sense on the weekly: if the weekly says wave 2, expect a three on the daily, not a five. A five there means one of the counts is off. Read the small timeframe against the large one, and the large one against the small one, before trusting either. This is a cross-check for a reading, not a forecast and not a signal, and the page does no live automatic wave-counting on market data.
MRT rebuild — Elliott Wave fractal breakdown (concept education; not a signal). Elliott Wave principle; breakdown structure inspired by @ItsStopFirst's “How I read waves, part 5” video. Original artwork; no video frames used.
Business Cycle Clock
Four-stage economic cycle: Expansion → Peak → Contraction → Trough.
MRT rebuild — classic business / economic cycle stages (education).
Timeframe Fractal Nesting
The same fractal motif at Weekly, Daily, and Intraday scales — nested self-similarity.
MRT rebuild — multi-timeframe fractal nesting (education).
Harmonic Cycle Overlay
Dominant cycle plus 2nd and 3rd harmonics; dashed path is their composite sum.
MRT rebuild — dominant cycle + harmonics overlay (Hurst-style education).
Nested Fractal Cycles
Short, medium, and long self-similar cycles overlaid — the same pattern at different scales.
MRT rebuild — Fractal Market Hypothesis / nested-cycle concept (Hurst-style education).